
Learn the Basics: How to Make Systems Maps Using Systems Thinking
In this guide you’ll learn how to:
- Understand the fundamentals of Systems Mapping: What it is, why it’s useful, and how it can help you understand complex issues.
- Create Your First Simple Systems Map: The guide provides a step-by-step approach, starting with choosing a simple system, identifying key elements, and connecting them visually.
- Build Upon the Basics: The article explains how to gradually increase complexity by adding more elements, considering feedback loops, and exploring different types of systems maps.
This is beginner’s guide to help you get started with Systems Mapping. You’ll quickly develop a foundational understanding of this valuable approach to problem solving.
FREE Systems Mapping Toolkit for Beginners
Get access to our step-by-step toolkit and start mapping your first system right away.
Get Access Now!Diving In: Your First Steps in Systems Mapping
Systems Mapping can feel daunting. The idea of understanding complex interconnections within a large system can seem overwhelming at first. But fear not! This guide is for absolute beginners, focusing on the simplest approach to get you started as quickly as possible.
What is a Systems Map?
Systems Mapping is a technique to create a visual map of how different parts of a system interact and influence each other. It’s a powerful technique for tackling complex challenges in various fields, from business and environmental issues to social and political problems.
Why is Systems Mapping Useful?
- Understanding Complexity: It helps us see how different parts of a system are connected and how they influence each other.
- Identifying Problems: By mapping a system, we can identify potential problems or key bottlenecks. We can then apply further research techniques like Design Thinking to solve highlighted problem areas with better solutions.
- Finding Solutions: Systems Maps can help us generate better solutions and innovations by showing where interventions might have the biggest impact.
Why Start Simple?
Just like learning to swim, you don’t dive into the deep end immediately. Systems Mapping is a skill that develops with practice. By starting with basic concepts, you’ll build a solid foundation for more complex analysis later on.
Who is this For?
This guide is for:
- Curious minds: if you just want to just get started with systems mapping as quickly as possible.
- Those with no prior experience with Systems Thinking or Systems Mapping techniques.
This guide is not for:
- Experienced Systems Thinkers: If you’re already familiar with causal loop diagrams, stock and flow models, or other advanced mapping techniques, this guide will be too basic for you.
Tips for Beginners
- Start Simple: Begin with a small, well-defined system.
- Focus on Key Relationships: Don’t try to include every detail.
- Iterate and Refine: Your map will likely evolve as you learn more about the system.
- Collaborate: Discuss your map with others to get feedback and refine your understanding.
How to Create Your First System Map
Getting Started: The Absolute Basics
1. Choose Your Challenge Space or Goal: Start with something familiar and manageable.
For example: 1) Your local coffee shop business landscape. 2) Reducing the flow of traffic on your street. 3) Increasing the flow of information within your household.

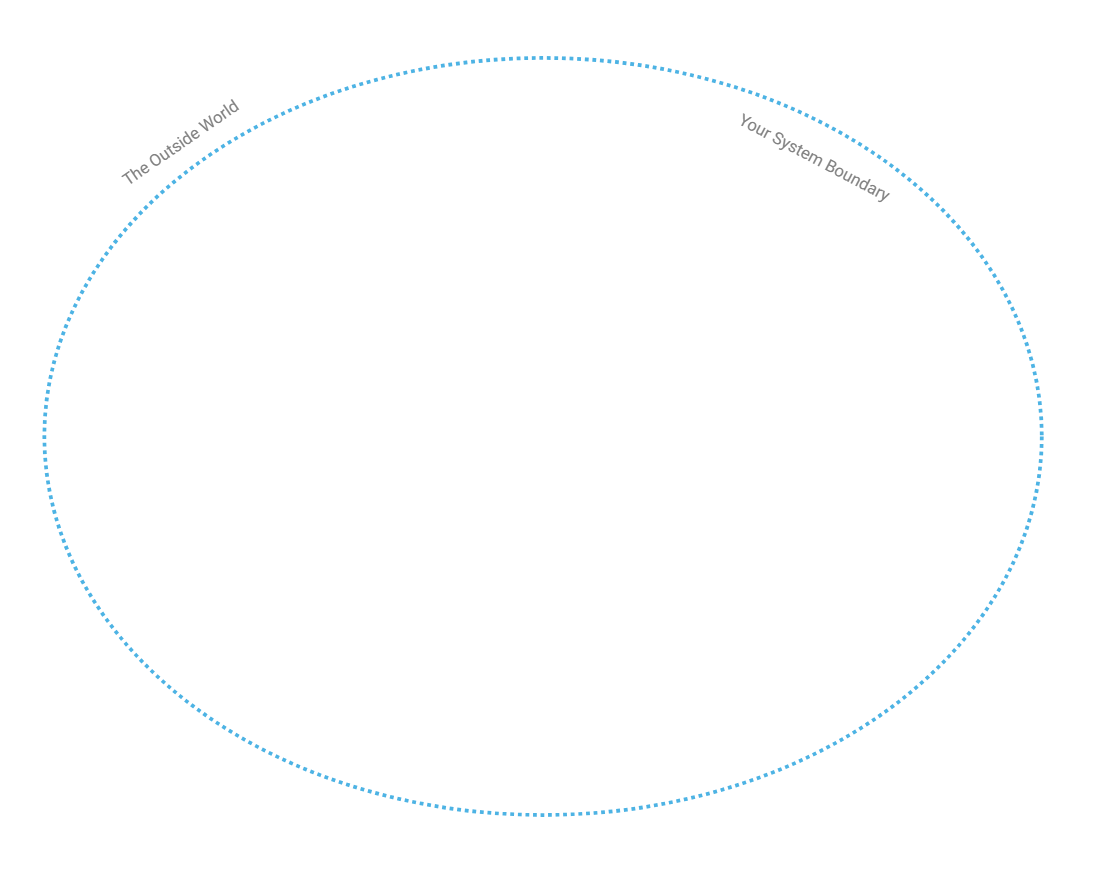
2. Define your System Boundary: Decide what is in and out of scope for your challenge space. Keep it manageable at first. What is in scope and out of scope?
3. Identify Key System Elements: List all the main components, factors or elements of your chosen system. These are anything that has a force of influence on your system. Keep it concise: 5-10 is a good enough starting point (think: people, organizations, resources, behaviours, policies, structures, processes…).
Consider the examples list below to get you thinking.
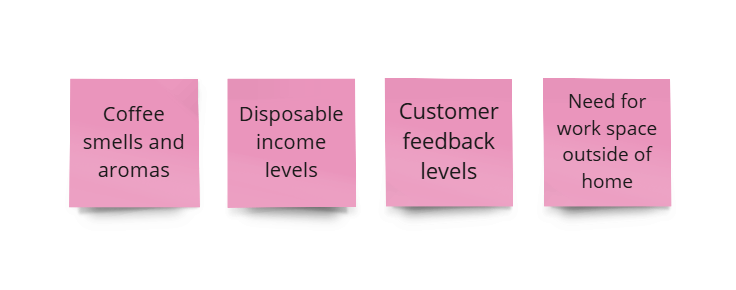
Coffee Example System Factors:
Customers:
- Orders
- Pays
- Consumers
- Provides Feedback
Barista:
- Takes Orders
- Prepares Drinks
- Handles Transactions
- Maintains Equipment
Coffee Beans:
- Source
- Delivery
- Storage
- Grinding
- Aromas
Coffee Machine:
- Brewing
- Maintenance
- Cleaning
Milk/Cream:
- Delivery
- Storage
- Chilling
- Steaming
Inventory:
- Management
- Ordering
- Storage
Suppliers:
- Coffee Bean Providers
- Milk Suppliers
- Equipment Suppliers
Location:
- Foot Traffic
- Local Competition
- Accessibility
Marketing:
- Advertising
- Promotions
- Social Media
Waste Management:
- Coffee Grounds
- Packaging
- Recycling
Staffing:
- Hiring
- Training
- Scheduling
Finance:
- Revenue
- Costs (rent, utilities, salaries)
- Profit
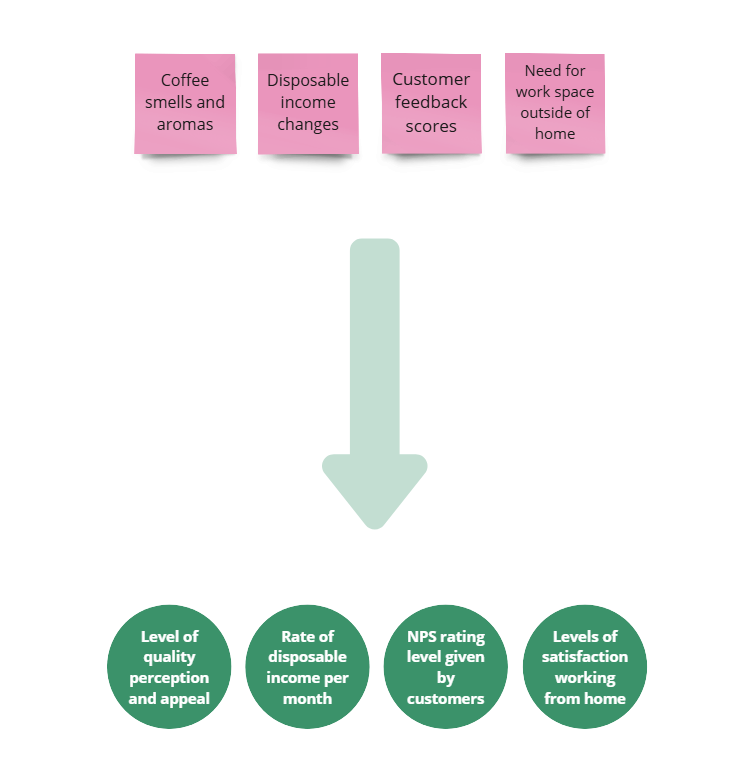
4. Translate Key Elements into Variables: Translate your list of key elements into variables. These are anything that can be quantified and can increase or decrease in some way.
Example elements translated into quantifiable variables for a coffee shop:
- Coffee smells and aromas -> Level of aroma quality perception and appeal
- Disposable income changes -> Rate of disposable income per month
- Customer feedback scores -> NPS rating given by customers
- Need for work space outside of home -> Levels of satisfaction working from home
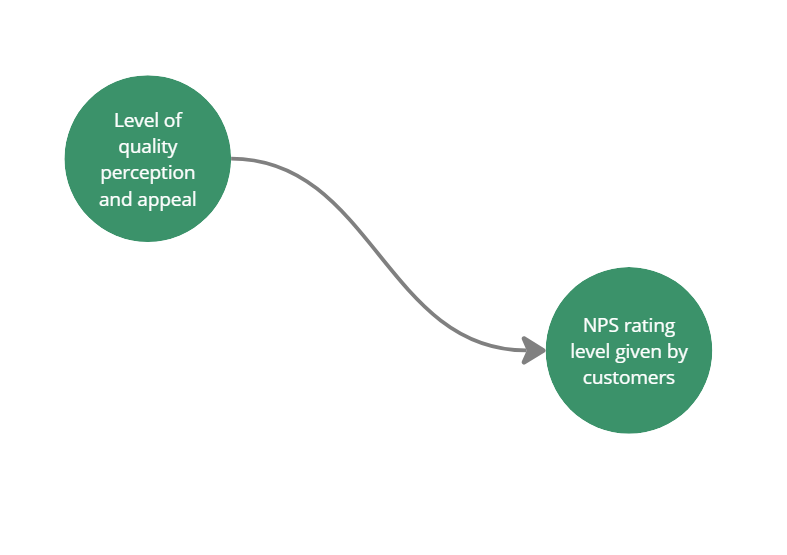
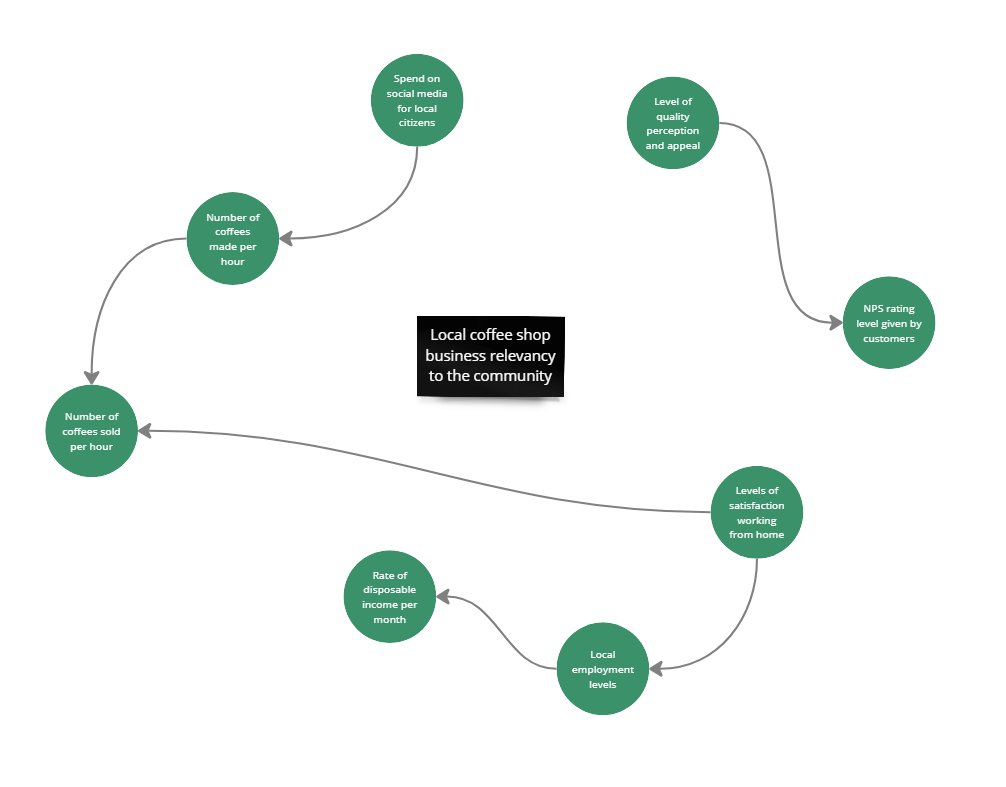
5. Connect the Variables: Draw simple arrow lines between the variable elements to show how they interact. For example: “Customers order coffee,” “Number of foot traffic per day,” “Level of quality and appeal of aromas,” “NPS score for the coffee shop”…
-
- Ask yourself: ‘what leads to more or less of x for all elements within the system?’
- Add in further elements and factors as variables as you think of them.
6. Visualise Your Map: Tools like pen and paper, drawing software, or online platforms (like Miro & Mural) can help. Clarity is Key: Make sure your map is clear, concise, and easy to understand.
TIP: Use different line styles (solid, dashed, dotted) to represent different types of relationships.
TIP: Remove surplus elements and variables that are not important or significant to your understandings.
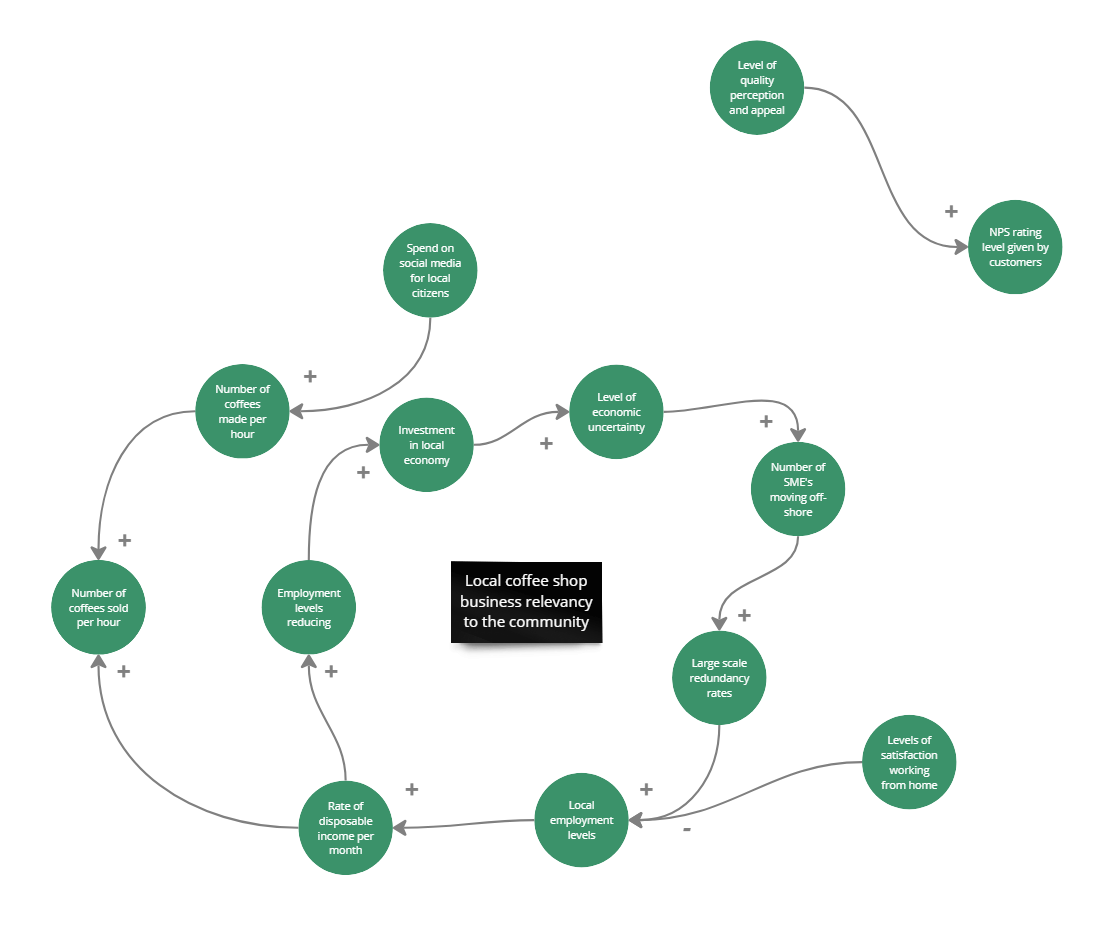
7. Add in Positive (+) and Negative (-) Symbols: for each interaction line you just added, place a + or a – next to each arrow head to show if it is a positive or negatively influencing relationship between the two.
Building on the Basics
Once you’re comfortable with these simple maps, you can gradually increase complexity.
- Gradually include more elements, components and relationships as variables to help you iterate your systems map with more detail.
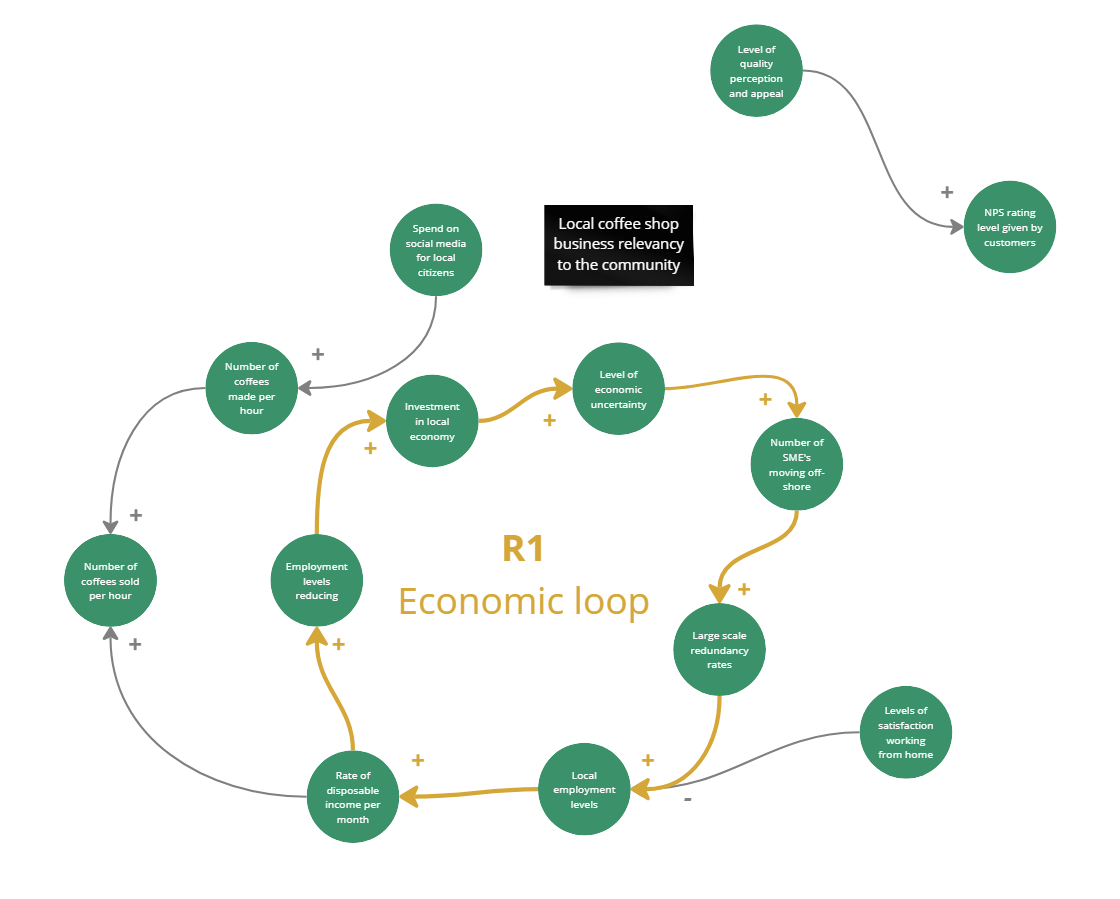
8. Causal Loops: Consider Feedback Loops. How do the actions within the system influence each other? Where are the circular feedback loops in the direction of your arrows?
Add in Your Feedback Loop Types: Once you’ve located some feedback loops, decide if they are
Reinforcing Loops (R): positive – these amplify change in the same direction as viscous cycles.
- For example, increased investment in education leads to a more skilled workforce, which leads to economic growth, which allows for further investment in education.
Balancing Loops (B): negative – these resist change and maintain the desired state.
- For example: A thermostat: When the temperature in a room rises above the set point, the thermostat signals the air conditioner to turn on, cooling the room back down.
Ask Yourself: Where do things improve or get worse in the system map and why?
Label feedback loops with an R (for Reinforcing) or B (for Balancing) to denote which type they are and where.

TIP: Don’t Overthink It: This is about getting started, not creating a masterpiece. Focus on the core relationships. What is influencing what and why? Where do relationships and causal loops create positive or negative change across the system?
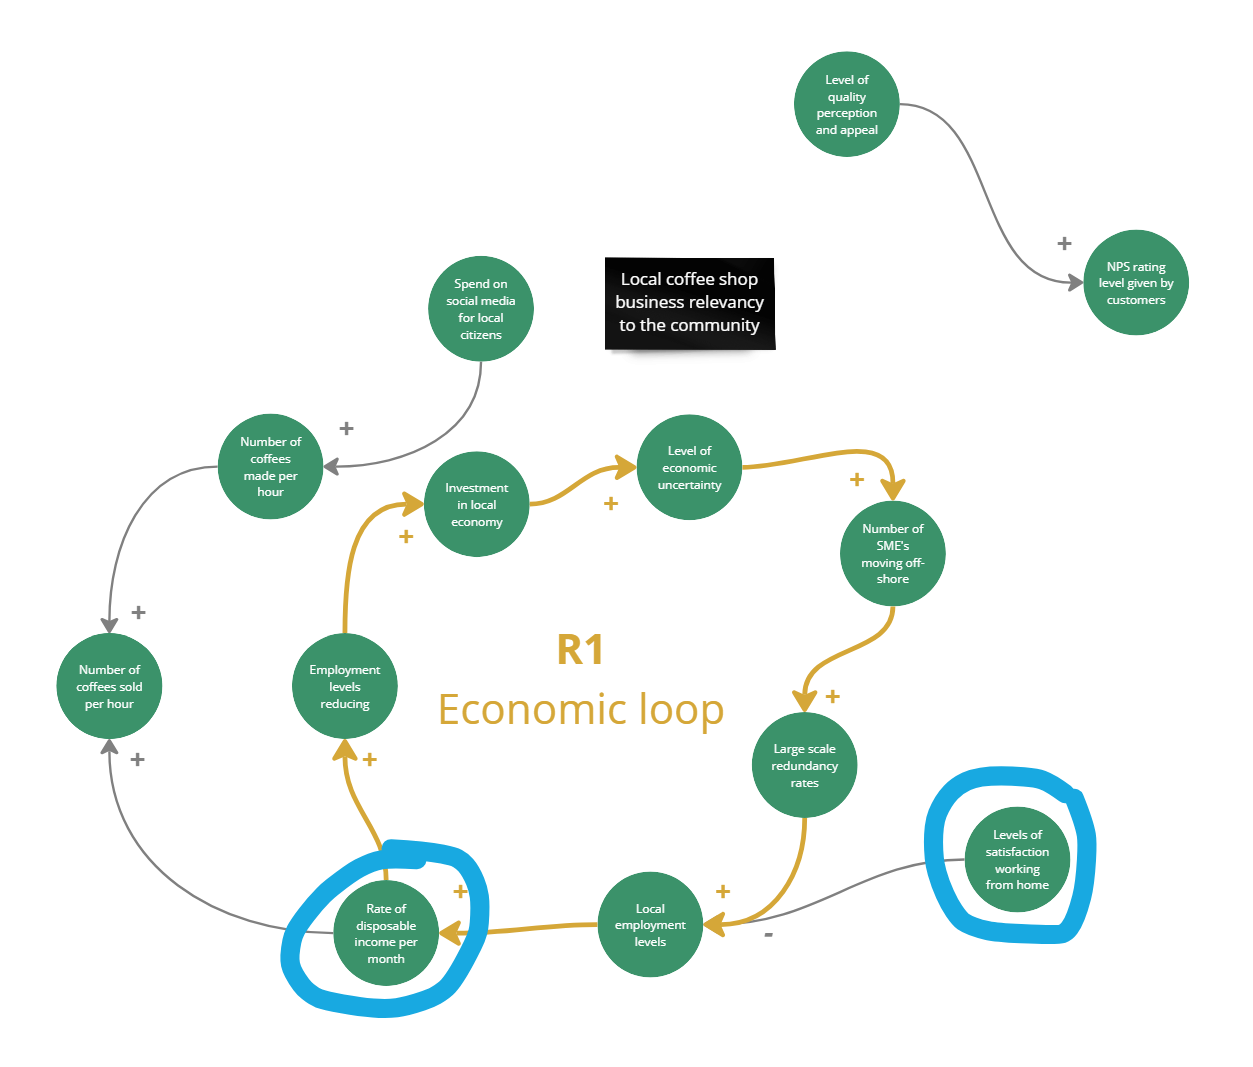
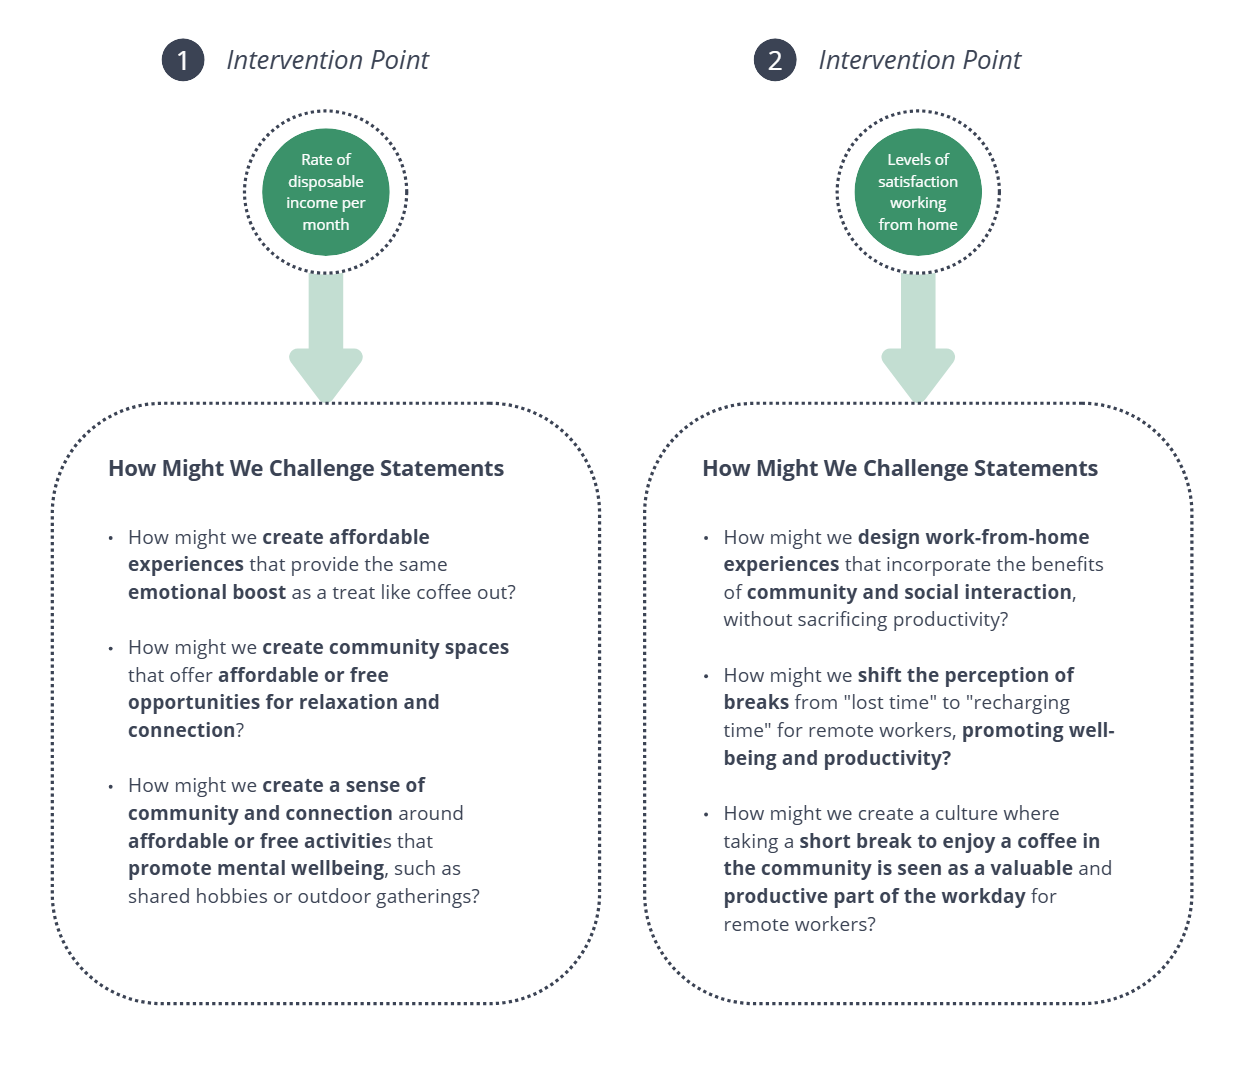
9. Highlight Future Intervention Points: Identify 1-2 causal loops that have the most potential to generate positive intended change in alignment with your initial system goal.
- Use your causal loops as possible future initiatives or intervention points of change.
- You can then use these intervention points to craft and create specific How Might We (HMW) challenge statements to solve for using approaches like Design Thinking.
For example: How might we address people’s fears about levels of disposable income so that they still find value and time in getting out of the house to enjoy good quality coffee drinking experiences?
Key Takeaways
- Systems Mapping is a journey, not a destination. Start with simple exercises, gradually increasing the complexity as you gain confidence. The most important thing is to begin exploring and understanding the interconnectedness of the world around you.
- Systems Maps are a research tool to help you visualise complex situations and contexts in a way that is manageable and repeatable. Their use lies in helping you prioritise and derive specific locations where you can influence and orchestrate change across the system.
- Once you start executing on your interventions, you will need to listen closely to the system again. Change outcomes are emergent. There will be intended and unintended consequences of your intervention(s). Make sure to monitor change trajectories to bring about the intended system level changes you’re after!
Start Using Our FREE Systems Mapping Toolkit for Beginners
We want to lower the barriers to entry for teams to get started building Systems Maps. So that we can tackle more complex problems and challenges around us. That’s why we put together our FREE Systems Mapping Toolkit for Beginners.
Make sure to get in touch to let us know how you got on with it. We’d love to hear from you.
Get our FREE Systems Mapping Toolkit for Beginners
Get access to our toolkit and start mapping your first systems right away.
Get Access Now!Ready to Take Your Systems Thinking Skills to the Next Level?
Learn more about our training programs on Systems Mapping and Systems Thinking, including how to apply the approaches most effectively to your specific business challenges.
We provide 1:1 help and support in how to build and generate actionable Systems Maps tailored to your industry and specific context.
Let’s unlock the power of Systems Thinking within your organization. Get in touch below!

Let’s talk!
Reach out below
We’ll discuss your specific sustainable business-innovation challenges and what to do about them

Mike Pinder is a cross-industry business and innovation consultant, thought leader, author, senior trainer, lecturer and international keynote speaker. He’s driven by using innovation to leave the World a better place than we found it. Mike is a co-founder of Wicked Acceleration Labs (an industry-academia research lab aimed at tackling complex Systemic and Wicked Problems), Member of Board of Advisors at Global Innovation Institute (GInI), & Honorary Practice Fellow at Imperial College London Business School.
Mike consults and leads across Innovation Strategy, Systemic Design, Systems Thinking, Design Thinking, Lean Start-up and Entrepreneurship, Business Model Innovation in both B2B and B2C. He guides, trains and facilitates: C-Level Innovation Strategy, AI Enhanced Innovation Process and Methods, Tool Development and Design, Innovation Accelerators, Innovation Capability Training Programs, Academic Research, Executive Education (Exec Ed), University Program Design, Intrapreneurship, Digital Transformation, Design Sprints and more.
Photography by: @USGS